Tailwinds Ahead for Sentosa Cove as Market Recovers

In the eyes of many homebuyers and market observers, Sentosa Cove properties may have seen much better days. However, the narrative may be shifting, as the tide looks to turn for these oceanfront homes.
Once touted as "the world's most desirable address", the market for Sentosa's non-landed private homes has been lacklustre after multiple rounds of cooling measures over the last decade. In particular, the additional buyer's stamp duty (ABSD), total debt servicing ratio (TDSR) framework, and tighter loan curbs have put a drag on the resort island's market activity.
To this end, some developers have held off sales previously, opting to lease the units until the time is right for them to be relaunched on the open market (e.g. The Residences at W Singapore Sentosa Cove, and Cape Royale).
Despite all that has been said, Sentosa Cove seems to be sailing out of rougher seas, as recent market data have showed signs of recovery. The rental yield on price quantum for Sentosa Cove non-landed private homes has shown consistent growth, from 2.8% in 2020 to 3.3% in 2024. The period from January 2024 to January 2025 saw the highest rental yield at 4.0% (see Table 1).
Table 1: Rental Yield on Price Quantum^ for Sentosa Cove Non-landed Private Homes
| Project Name | 2020 | 2021 | 2022 | 2023 | Jan 2024 to Jan 2025* |
| CAPE ROYALE | N.A. | N.A. | 3.0% | 3.2% | 3.2% |
| MARINA COLLECTION | 1.8% | 2.1% | 2.3% | 3.2% | 2.0% |
| SEASCAPE | 2.9% | 2.2% | 3.2% | 3.5% | 3.7% |
| SEVEN PALMS SENTOSA COVE | N.A. | 1.6% | N.A. | N.A. | 4.0% |
| THE AZURE | 3.0% | 3.4% | 3.6% | 4.1% | 2.2% |
| THE BERTH BY THE COVE | 3.0% | 2.7% | 3.2% | 4.3% | 3.5% |
| THE COAST AT SENTOSA COVE | 2.8% | 2.8% | 3.8% | 3.9% | 3.9% |
| THE OCEANFRONT @ SENTOSA COVE | 2.0% | 3.3% | 2.9% | 4.3% | 3.4% |
| THE RESIDENCES AT W SINGAPORE SENTOSA COVE | N.A. | N.A. | N.A. | 6.3% | 4.2% |
| TURQUOISE | 3.2% | 3.1% | 3.6% | 3.8% | 3.0% |
| Overall | 2.8% | 2.6% | 2.9% | 3.3% | 4.0% |
Table 2: Rental Yield on Price Quantum^ for CCR Non-landed Private Homes
| CCR District | 2020 | 2021 | 2022 | 2023 | Jan 2024 to Jan 2025* |
District 1 | 2.4% | 2.3% | 2.8% | 3.7% | 3.6% |
District 2 | 1.3% | 2.3% | 2.5% | 4.3% | 4.0% |
District 6 (CCR projects only) | 0.6% | 0.5% | 0.7% | 0.8% | 0.5% |
District 7 (CCR projects only) | 1.9% | 1.6% | 2.7% | 3.4% | 3.7% |
District 9 | 1.9% | 1.9% | 2.4% | 2.7% | 2.7% |
District 10 | 2.0% | 1.9% | 2.3% | 3.0% | 2.8% |
District 11 | 2.3% | 2.2% | 2.5% | 3.1% | 2.7% |
District 4 (CCR projects only, Sentosa Cove^^) | 2.8% | 2.6% | 2.9% | 3.3% | 4.0% |
| CCR Overall (ex. Sentosa Cove) | 2.0% | 1.9% | 2.3% | 3.0% | 2.8% |
| Sentosa Cove Overall vs. CCR Overall | +0.8% | +0.7% | +0.6% | +0.3% | +1.2% |
Additionally, Sentosa's rental yields have consistently performed higher than that of their other Core Central Region (CCR) counterparts on the main island, with the percentage difference peaking at 1.2% for the January 2024 to January 2025 period (see Table 2).
Limited stock supports rentals
There have been no new private condo launches in Sentosa Cove in more than 14 years, since Seascape and The Residences at W Singapore Sentosa Cove hit the market in 2010. Looking ahead, there appears to be no other private residential plot lined up in Sentosa, based on the 2019 URA Master Plan. This means that the private non-landed housing supply on the resort island will remain tight at just over 1,700 units (see Table 3), which may help to support rentals amid stable leasing demand.
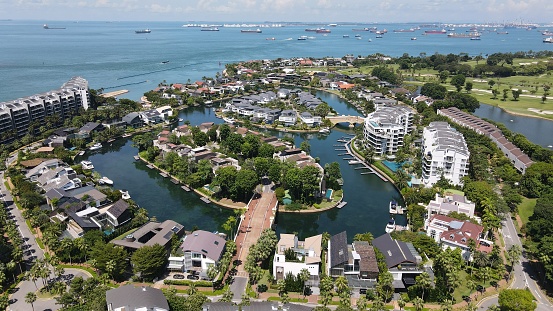
Overall, it seems like the skies may be clearing for the non-landed private homes in Sentosa, and there are potential opportunities for homebuyers who take a longer-term view on their investment. Besides, homes in Sentosa Cove typically stand out from residential properties elsewhere because they offer coastal-style, resort living, spacious unit sizes, stunning seaviews, and a sense of prestige. Sentosa Cove is also a stone's throw from Singapore's largest mall Vivocity, and other commercial and entertainment offerings at Resorts World Sentosa, one of two integrated resorts in the country.
Table 3: Number of Non-landed Private Homes in Sentosa Cove
| S/N | Project Name | Number of Units |
1 | CAPE ROYALE | 302 |
2 | MARINA COLLECTION | 124 |
3 | SEASCAPE | 151 |
4 | SEVEN PALMS SENTOSA COVE | 41 |
5 | THE AZURE | 116 |
6 | THE BERTH BY THE COVE | 200 |
7 | THE COAST AT SENTOSA COVE | 249 |
8 | THE OCEANFRONT @ SENTOSA COVE | 264 |
9 | THE RESIDENCES AT W SINGAPORE SENTOSA COVE | 228 |
10 | TURQUOISE | 91 |
| Total Number of Units | 1,766 | |
Fewer competition with foreign buyers
In April 2023, the government raised the ABSD rate for foreigners purchasing any residential property in Singapore from 30% to 60%, in a bid to tame the demand from foreign investors and promote sustainability in the property market (see Table 4). With a pullback in foreign investment demand, this could mean that Singapore citizens and PRs would likely face less competition from foreign buyers when they seek to buy a prime residential property, including in Sentosa Cove, which is relatively popular with foreigners prior to the sharp ABSD hike.
Table 4: Prevailing ABSD Rates
Buyer Profile | Residential Property | ABSD Rates on/after 27 April 2023 |
| Singapore Citizens (SC) | 1st | N.A. |
2nd | 20% | |
3rd or subsequent | 30% | |
| Singapore Permanent Residents (SPR) | 1st | 5% |
2nd | 30% | |
3rd or subsequent | 35% | |
| Foreigners buying any residential property | Any | 60% |
Based on URA Realis caveat data, foreigners (non-PR) accounted for anything between 8% and 32% of the non-landed new and resale private home sales in District 4 - where Sentosa Cove is at - from 2005 to 2019, before Covid hit. In 2023, this proportion was at 11.3% before falling to 4.3% in 2024, with the punitive ABSD likely played a role in crimping foreign demand. PropNex believes the moderation in buying demand from foreigners could potentially offer opportunities for local buyers.
Future Development
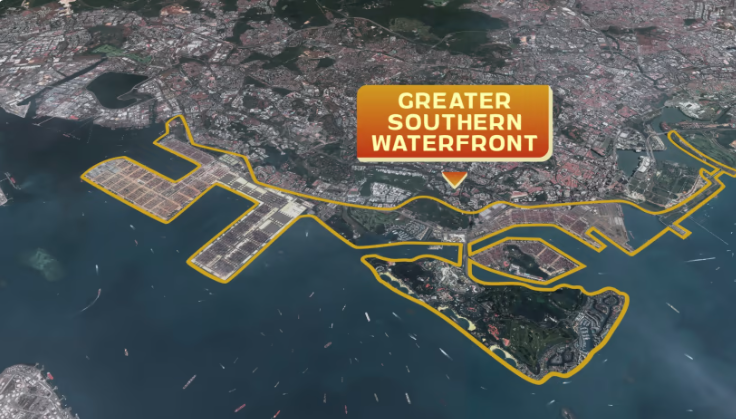
What makes the future of Sentosa more exciting is the upcoming Greater Southern Waterfront (GSW) precinct nearby, and the expansion of Resorts World Sentosa (RWS) which will bring more vibrancy to the area.
The GSW extends from Pasir Panjang to Marina East, and a continuous promenade will integrate various places of interest, parks, hills and the waterfront along Singapore's southern coast. Development is set to take place over the next 5 to 10 years, and part of the GSW will include the redevelopment of the former Keppel Club into a new residential precinct.
Meanwhile, the RWS is currently undergoing a major expansion set to complete in 2030. A new waterfront lifestyle development comprising a waterfront promenade, retail podium and two luxury hotels will be added to the integrated resort's existing attractions. This expansion is expected to create more jobs and attract more visitors to Sentosa, rejuvenating Asia's Favourite Playground "where discovery never ends".
With all that is in store for Sentosa and its surrounding areas, Sentosa Cove looks ready to take centre stage again as one of Singapore's most desirable places to live. Do get your trusted PropNex agent onboard for more insights on your next property move.
Views expressed in this article belong to the writer(s) and do not reflect PropNex's position. No part of this content may be reproduced, distributed, transmitted, displayed, published, or broadcast in any form or by any means without the prior written consent of PropNex.
For permission to use, reproduce, or distribute any content, please contact the Corporate Communications department. PropNex reserves the right to modify or update this disclaimer at any time without prior notice.


Oh no!
Enjoy our Content?
If it is of any consolation, know that you are not alone in this real estate journey. Let us show you the way to make this journey an interesting and enjoyable one!
Suggested Reads


Upcoming Events
View more
You may like

Resale Landed Market Watch In June 2026
July 29, 2026

Bayshore Drive: Idyllic Homes In A New Precinct
July 22, 2026

Working Till 69 Won't Buy You A Longer Home Loan
July 21, 2026

Bank Of Mum & Dad 2: How To Help Your Child Buy A Home Without Risking Your Future
July 16, 2026

Resale Condo Market Watch in June 2026
July 15, 2026